If your PC always restarts every few minutes, shuts down and restarts during gaming, or blue-screens and boots into BIOS, you can check your Windows System Crash Logs aiming to find the reasons behind them. Open Windows Event Viewer and check the error ID, but still don't know what happened to your PC (you may find Kernel-Power - Event ID 41, or Display 4101, which actually indicates a BSOD problem and a display driver issue). In this blog, you can learn how to check Windows system crash logs and use a system crash log analyzer to dig out the relevant system issue. Please read on.
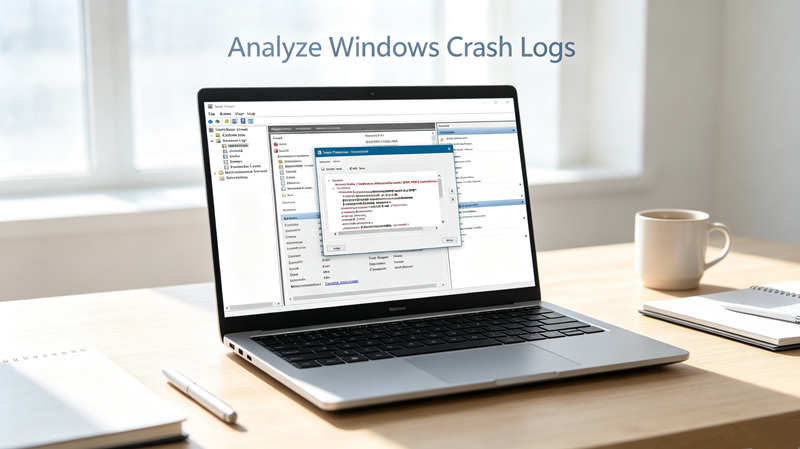
Common Scenarios of Windows System Crash Logs
Here in this part, you will see 5 frequently seen crash logs. These representative crash logs usually occur when your PC has driver conflicts, GPU-caused display errors, hardware errors, file system corruption, and disk errors.
What are frequently observed crash logs?
1. Kernel-Power — Event ID 41
A universal crash report when your PC shuts down or restarts unexpectedly.
2. BugCheck 1001
This happens when your Windows experiences a bug check/BSOD.
3. WHEA-Logger 18/19
The hardware involved may be unstable, misconfigured, overheating, or actually faulty/Fatal hardware error detected/Corrected hardware error.
4. Display 4101
Display driver stopped responding and recovered.
5. Ntfs 55/9
File-system corruption or inconsistency detected/NTFS volume needs attention/checking.
How to Check Windows System Crash Logs Windows 10/11 Via Event Viewer?
When your system suddenly crashes and you don’t know why, you can use Windows Event Viewer to check system Error ID to see what exactly is going on.
How to check Windows system crash logs?
Note that you need to do the actions below right after your PC’s abnormal shutdown or restart, or the crash log will not be recorded or found.
Step 1. Search for ‘Event Viewer’ in the search bar and open it.
Step 2. Find the ‘Windows Logs’ category.
Step 3. In the drop-down menu, firstly click on ‘System’ to see all the system error logs. Later, you can go to ‘Application’ to find process errors.
The thing is that you may not instantly find the Kernel-Power, Event 41. You can use the filter to manually sift through ‘Critical Events’ and easily locate this event.
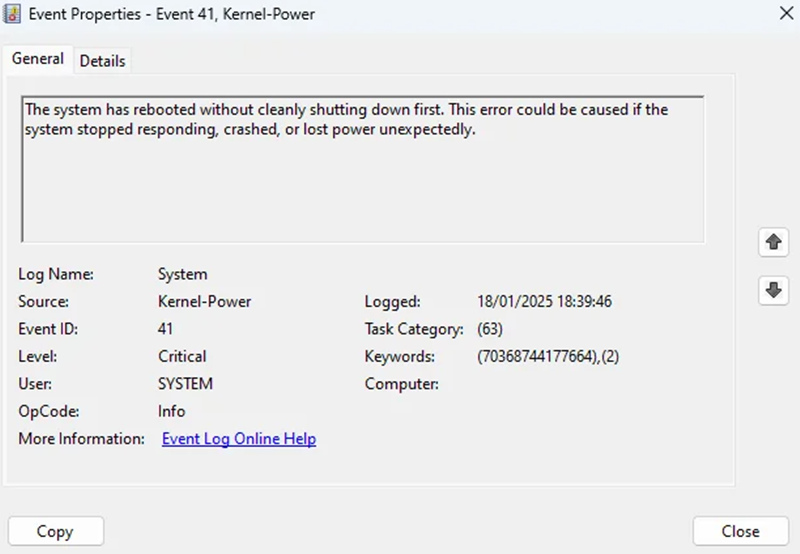
How to create a custom view to find all critical events?
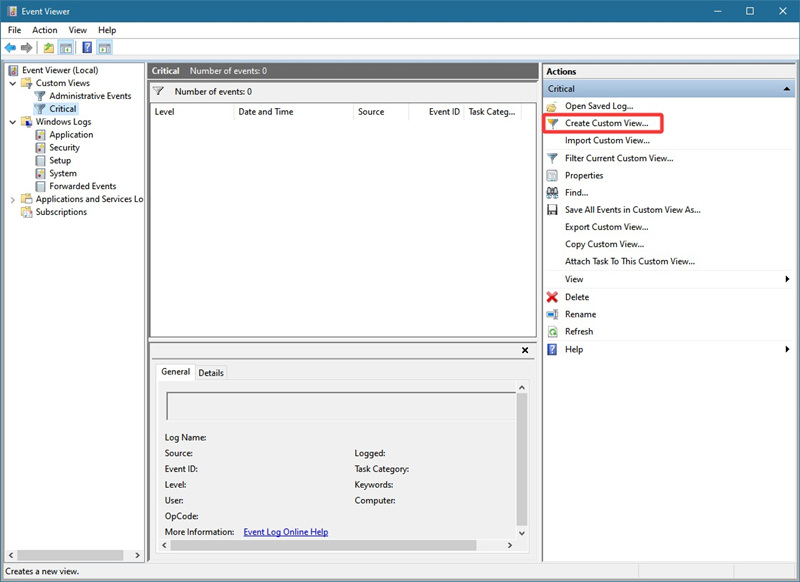
Step 1. Open Windows Event Viewer and you need to build a new category in Windows Event Viewer to quickly sift all critical errors.
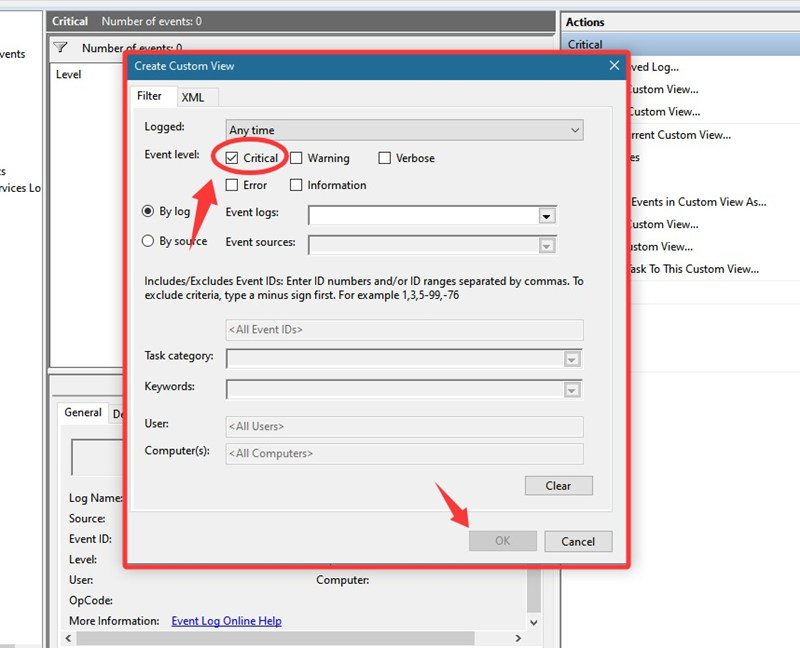
Step 2. Tick the ‘Critical’ box under the ‘Event Level’ and then press the OK button.
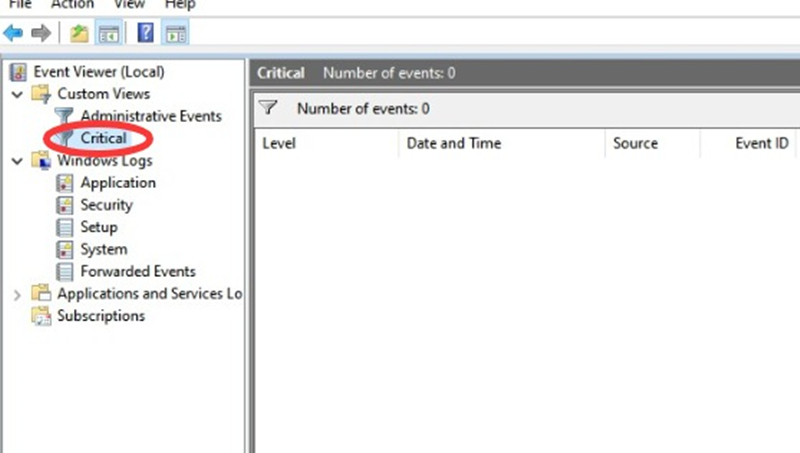
Step 3. Under the Custom Views category, you can see this filter. Click on it, and all the ‘Critical’ events will be gathered together.
Step 4. Find out what’s causing your system to crash.
What info can you obtain from Windows system crash logs?
Date and time (Based on this info, you can know whether this error happened just now and prove it is the source behind the problem)
Source (Check what the root cause is of your Kernel Power, WHEA-Logger, Display)
Event ID (Like 41,1001,6008 are all classic event IDs that represent sudden system crashes)
Kernel Power 41 is the most well-known critical error that can be traced back to Kernel Power, possibly triggered by Power Supply issues, a system freeze, or a BSOD. But to know the exact factor that causes a system crash, we need a more powerful tool - WinDbg. A debugging tool to analyze dump files (the records of system crashes). Please read on.
Method 2. How to Analyze Crash Logs Via DMP Files?
.dmp files are kinda like a quick screenshot that stores the crucial crash info when your PC shuts down unexpectedly. If you know how to analyze this type of file, you can instantly know what caused your system to crash. WinDbg is the crash log analyzer we need here to read all the info contained in the .dmp files.
But how to get the dump files?
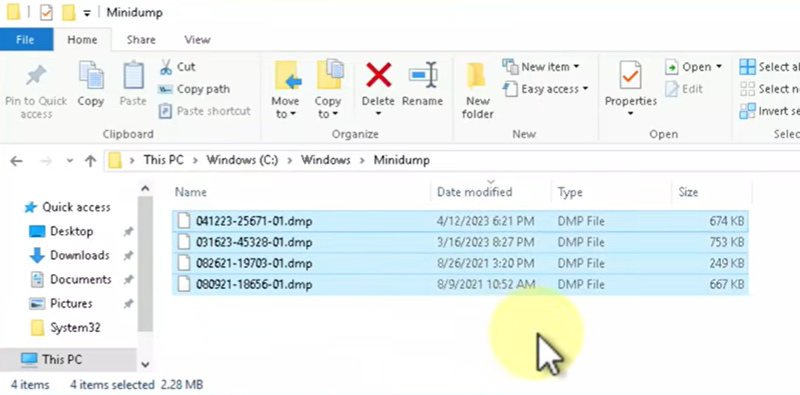
These types of files are normally automatically stored at a certain path in your local folder. You can copy and paste this path into ‘This PC’ and easily find some .dmp files.
Note that you need to pay attention to the ‘Date Modified’ column to accurately locate which .dmp file records your last system crash. You can use the Windows Event Viewer to get relevant time info.
How to use WinDbg to analyze dmp files and locate the exact crash issues?
Now it is time to analyze the dmp files. You can download Windows’ default debugging software from the Microsoft Store.
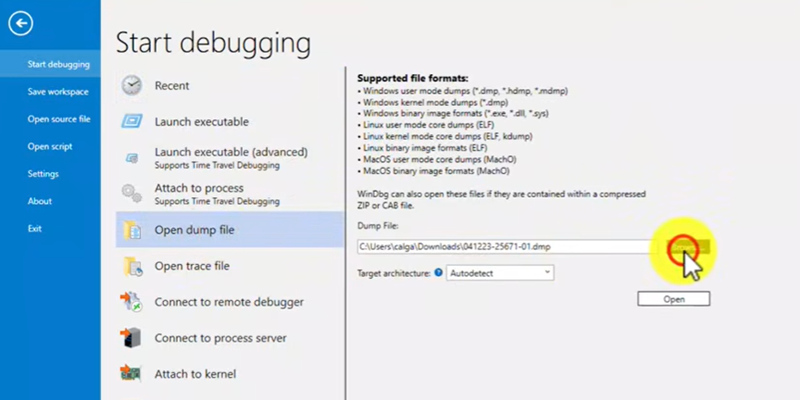
Step 1. Activate WinDbg and choose ‘Start debugging.’ Browse and open the dump file you prepared.
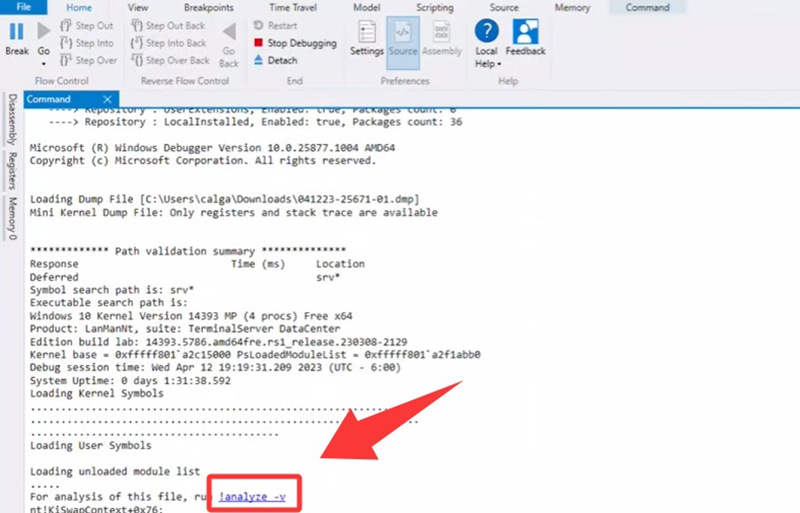
Step 2. Scroll down to find the ‘Analyze’ hyperlink. Click on it.
Step 3. From the lines, find the ‘Faulty Module.’
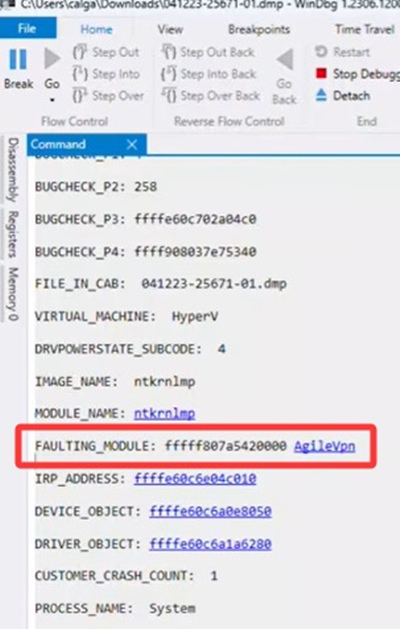
Now, from the image above, we know that, in this case, it is the AgileVPN that causes this system crash. It could be a driver conflict, and once we know the root cause, it is much easier to fix the crash and prevent it from happening again.
How to Fix System Crashes After You Finish Diagnosing?
Different types of system crashes require different tools to fix them. For example, if you encounter driver issues, you need a driver updater to fix conflicting drivers. If your programs fail to load and cause a blue screen, you need to fix your system. If it is a file corruption problem, or the storage hits it max volume.
1. Driver issues: Update outdated drivers, especially graphics, chipset, and storage drivers. If crashes started after a recent driver update, try rolling back or reinstalling the driver.
2. Hardware issues: Check your RAM, CPU, GPU, and other hardware for overheating or instability. Run a memory test, monitor hardware temperatures, and return any overclocking or undervolting settings to their defaults.
3. BSOD: Note the BSOD stop code and check the related crash logs or minidump files to identify the possible cause. Then troubleshoot the associated driver, hardware, or system component.
4. Storage issues: Check your drive for errors and run CHKDSK to repair file-system problems. Also check the drive's health and connections. If the drive is failing, back up your data and replace it.
5. Corrupted Files: Run DISM and SFC to scan, repair, and clean corrupted Windows system files. You can run DISM /Online /Cleanup-Image /RestoreHealth first, followed by sfc /scannow.
Bonus: Optimize Your System to Prevent Crashes - Advanced SystemCare
If you usually maintain your system well, you won't run into so many crashes. IObit Advanced SystemCare can help you unburden your system and protect your software. Here are the very useful functions you need to optimize your system and prevent sudden black screens and system crashes.
Advanced SystemCare Free
- Clean: 420 billion traces removed & 85 EB junk files cleaned
- Protect: 80 million unauthorized access blocked & 20 million bugs fixed
- Speed Up: 6 million hours of startup time saved & Turbo boost
- Optimize: Auto clean and auto care your PC with AI mode

Hardware issues - Performance Monitor / Health Checker
Monitors CPU, RAM, disk usage, temperatures, and other system conditions, helping users notice abnormal resource usage or overheating-related symptoms.
Driver issues - Driver Updater
Keeps outdated drivers updated. IObit specifically describes driver updating as a way to address device issues and system crashes. This tool is in IObit Advanced SystemCare's toolbox, need to download it to scan and update drivers.
BSOD - System Repair / Win Fix + Health Checker
ASC's system-repair tools can scan for and repair general Windows problems. Its Health Checker can also diagnose and automatically fix certain detected issues.
Storage issues - Disk Cleaner + Disk Error Fix
Cleans unnecessary files to free disk space, while ASC also provides a tool for fixing disk errors.
Corrupted Files / System problems - System Repair + Registry Cleaner
Can repair general Windows issues and clean invalid/obsolete registry entries that may affect system stability.
Conclusion
Windows system crash logs can provide valuable clues about why your PC suddenly freezes, restarts, or shows a BSOD. By checking Event Viewer for errors such as Kernel-Power, BugCheck, WHEA-Logger, and disk-related events, you can narrow down whether the problem is related to hardware, drivers, storage, or corrupted system files. Once you identify the likely cause, updating drivers, checking hardware, repairing disk errors, or restoring corrupted Windows files can help resolve the issue. Use a decent system care tool to maintain your system, optimize your PC's performance, IObit Advanced SystemCare gets all your demands covered.