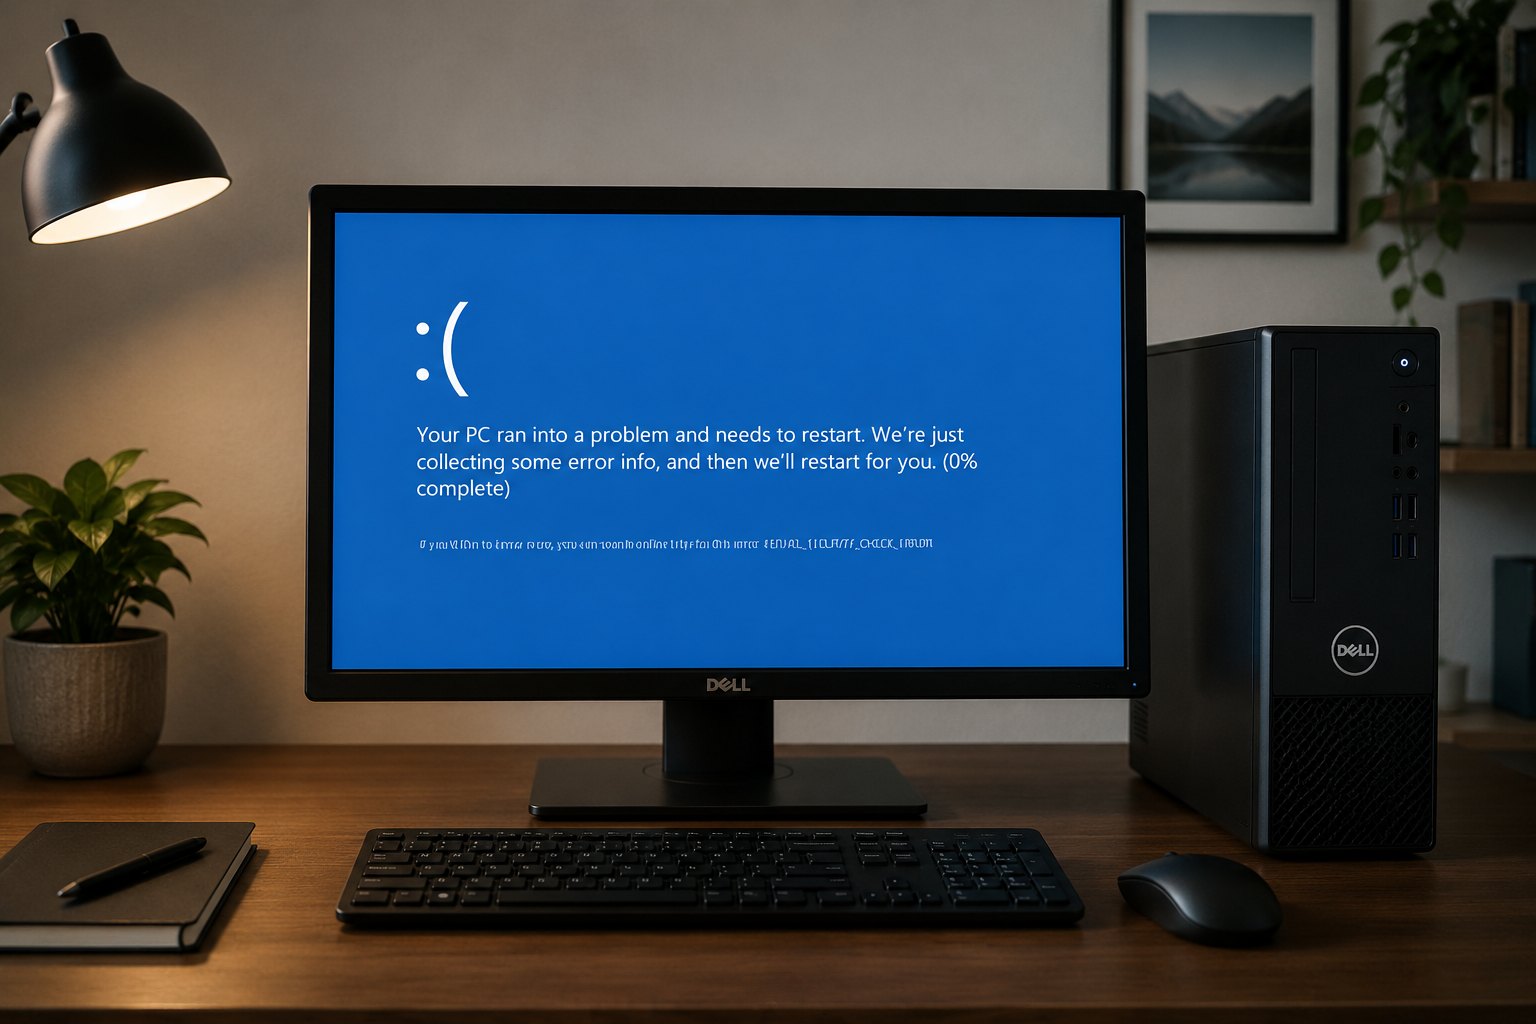
A resource monitor shows how your computer uses CPU, memory, disk, and network resources in real time. Windows provides built-in monitoring tools such as Resource Monitor and Task Manager, but lacks a gaming performance monitor for FPS, frame time, GPU load, and temperatures. Third-party system monitors combine all the core functions and let you have complete control over your PC.

What Are Resource Monitors?
A resource monitor is a utility that turns system activity into readable percentages, process lists, graphs, and performance data. When a PC slows down unexpectedly, a resource monitor helps identify whether CPU, memory, disk, or network activity is causing the bottleneck. Microsoft’s built-in Windows utility monitors CPU, hard disk, memory, and network activity in real time.
The main monitoring areas include:
Overview: Provides a condensed picture of active processes and major CPU, disk, network, and memory activity. Start here when you are unsure which system component is under pressure.
CPU: Shows processor activity from running applications, processes, and services. Sorting processes by CPU usage can help identify software responsible for sustained processor load.
Memory: Helps you inspect physical memory usage and find processes that are consuming unusually large amounts of RAM.
Disk: Displays disk activity associated with individual processes and files, which is useful when storage usage stays high even though you are not actively transferring files.
Network: Shows programs and processes generating network activity, helping you determine which applications are sending or receiving data.
Windows Resource Monitor is primarily a diagnostic utility. It helps explain what is using system resources, but it does not directly clean RAM, locate unnecessarily large files, or automatically optimize background programs. Users who want monitoring and optimization in the same interface may therefore prefer a third-party resource monitor app.
How to Use IObit Advanced SystemCare’s Resource Monitor
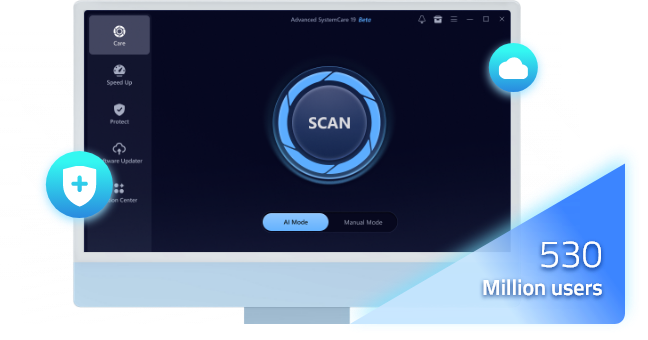
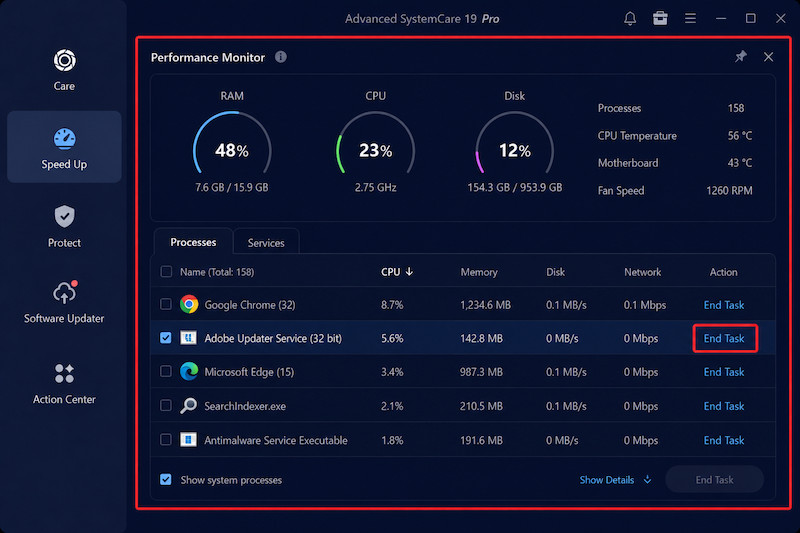
Beyond the built-in Windows tool, third-party applications also offer resource monitor-style features with additional optimization controls. In Advanced SystemCare, the built-in monitoring component is called Performance Monitor. It functions as a third-party resource monitoring tool by displaying RAM, CPU, and disk usage, resource-intensive processes, and additional system metrics. When expanded, it can show processes with high RAM, CPU, or disk activity. Its Metrics section can also display hardware information, including CPU, mainboard, and GPU temperatures as well as fan speed.
Step 1. Download and install Advanced SystemCare from the official IObit website, and then launch it on your Windows PC.
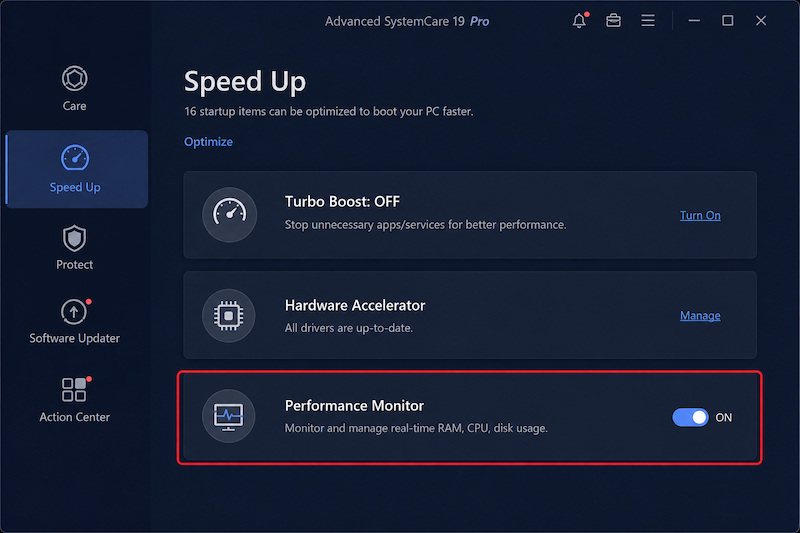
Step 2. Go to the program’s Speed Up area and enable Performance Monitor. The monitoring panel gives you a quick view of current RAM, CPU, and disk activity.
Step 3. Expand Performance Monitor when you need more detail. Review the processes with high RAM, CPU, or disk usage. If an unnecessary application is consuming excessive resources, select it and use End Task. Avoid terminating unfamiliar Windows processes.
Step 4. Open the Metrics tab when you need additional hardware information. The quick controls at the bottom of Performance Monitor also provide direct access to Clean RAM, Scan, Turbo Boost, and Screenshot.
What Can This Tool Do to Optimize Your System?
Clean RAM - RAM control can be useful after memory-intensive applications have been running for a long time or when available RAM has dropped significantly.
Locate and Remove Large Files - the Large File Finder helps identify files occupying significant amounts of storage.
Clean Disk - Advanced SystemCare can identify junk, logs, caches, temporary data, and leftover files generated by Windows, installed applications, and browsers.
Automatic System Boost - Turbo Boost can temporarily stop non-essential services and background applications to release more system resources.
How to Use Command Line to Open Windows Resource Monitor
Windows includes a free built-in Resource Monitor, so you do not need additional software simply to inspect system resource usage. Microsoft documents resmon as a direct way to launch the utility. If you are searching for resource monitor Windows 10 or resource monitor Windows 11, the built-in resmon utility is the tool Windows provides for detailed CPU, memory, disk, and network monitoring.
Is There a Resource Monitor Shortcut?
Windows does not provide a dedicated single-keystroke resource monitor shortcut comparable to Task Manager's Ctrl + Shift + Esc. A fast built-in method is to press Windows + R, enter resmon, and press Enter. Microsoft documentation also uses the Run dialog with resmon when instructing users to open the utility.
If you searched for “resource monitor how to open,” Command Prompt provides another simple way to launch it.
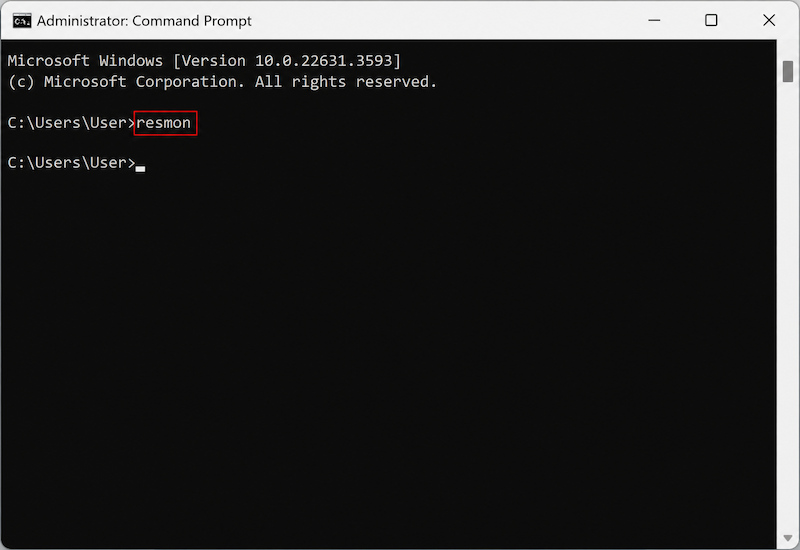
Step 1. Press Windows + R, type cmd, and press Enter to launch Command Prompt.
Step 2. Type:
resmon
Then press Enter. Windows will launch Resource Monitor.
Step 3. Choose the CPU, Memory, Disk, or Network tab depending on the problem you are investigating.
Step 4. Sort the relevant data to find resource-heavy processes. For example, when investigating high CPU usage, Microsoft recommends sorting the CPU list so that processes with the highest consumption appear first.
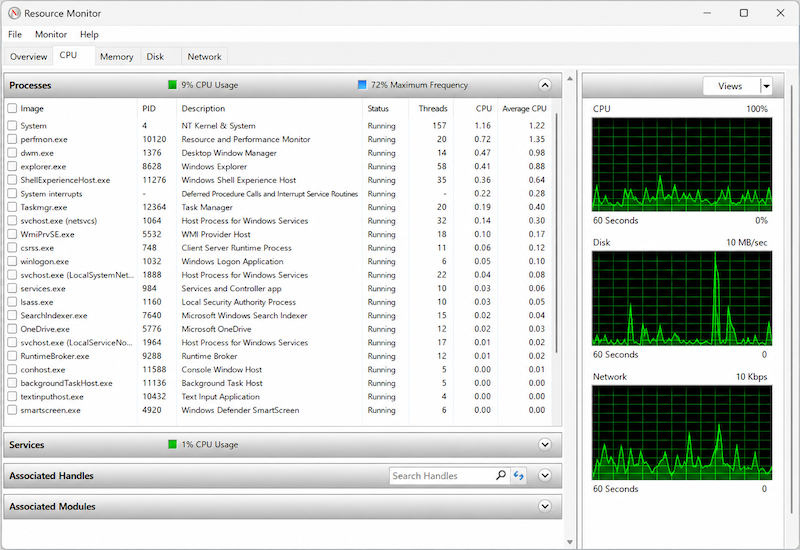
For resource monitor Windows 10 users, this built-in utility remains valuable because it provides process-level information instead of only showing an overall utilization percentage. The same resmon command also provides a convenient way to reach the utility on Windows 11.
How to Use Task Manager as a Resource Monitor
Task Manager is another built-in Windows tool for checking CPU, memory, disk, and network usage. It is often the fastest option when you simply need to identify an application that suddenly starts consuming too many resources. Microsoft describes Task Manager as a system troubleshooting tool that monitors performance and manages running processes. Its Processes view displays CPU, memory, disk, and network usage for active applications and background processes.
What Is the Task Manager Shortcut?
Press Ctrl + Shift + Esc to open Task Manager directly. Microsoft officially documents this keyboard combination as a direct Task Manager shortcut. It is not technically a resource monitor shortcut for resmon.exe, but it is often faster when your goal is simply to identify a resource-heavy application.
Step 1. Press Ctrl + Shift + Esc to open Task Manager.
Step 2. Open Processes. Check the CPU, Memory, Disk, and Network columns to compare resource consumption across running applications and background processes.
Step 3. Select a column such as CPU or Memory to sort the list by usage. Microsoft specifically recommends sorting CPU usage from highest to lowest when diagnosing unusually high processor activity.
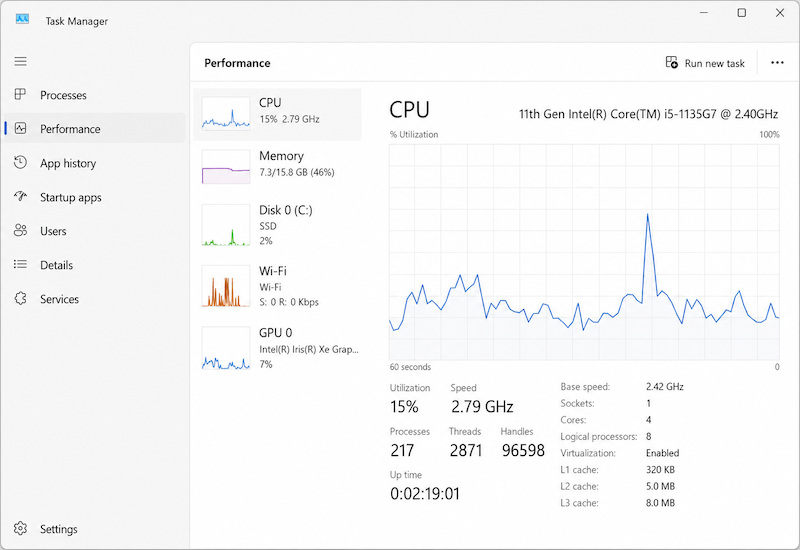
Step 4. Open Performance when you want a broader view of overall hardware utilization. If a program is frozen or is clearly consuming unnecessary resources, return to Processes, select it, and choose End task. Do not end unfamiliar system processes simply because they appear near the top of the list.
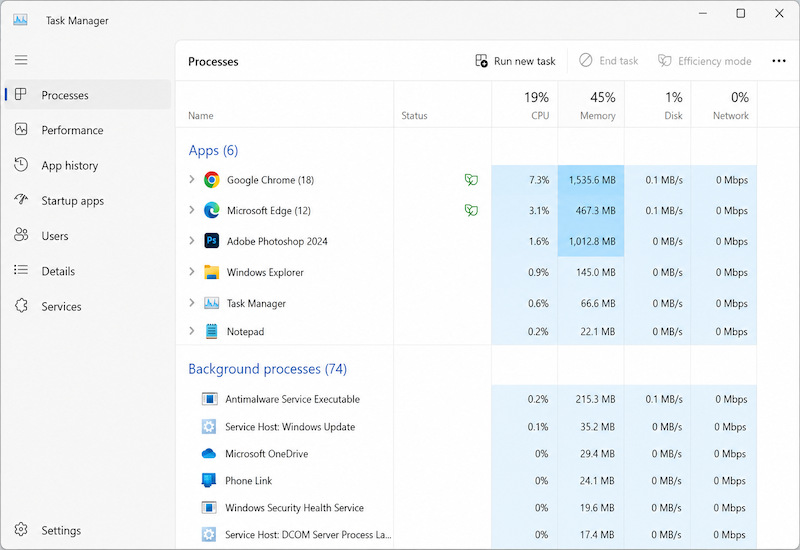
Task Manager works best for quick diagnosis, while Resource Monitor provides more detailed process, disk, and network information. Using the two together can help you move from noticing that a PC is slow to identifying the application or hardware resource responsible for the bottleneck.
How to Use Snowflake Resource Monitor
Snowflake Resource Monitor is not a PC performance tool. It tracks credit usage for Snowflake virtual warehouses and can trigger notifications or suspend warehouses when usage reaches set limits. For serverless features or AI services, Snowflake recommends using Budgets instead.
Step 1. Sign in to Snowsight with the ACCOUNTADMIN role.
Step 2. Go to Admin > Cost management > Resource Monitors, and select + Resource Monitor.
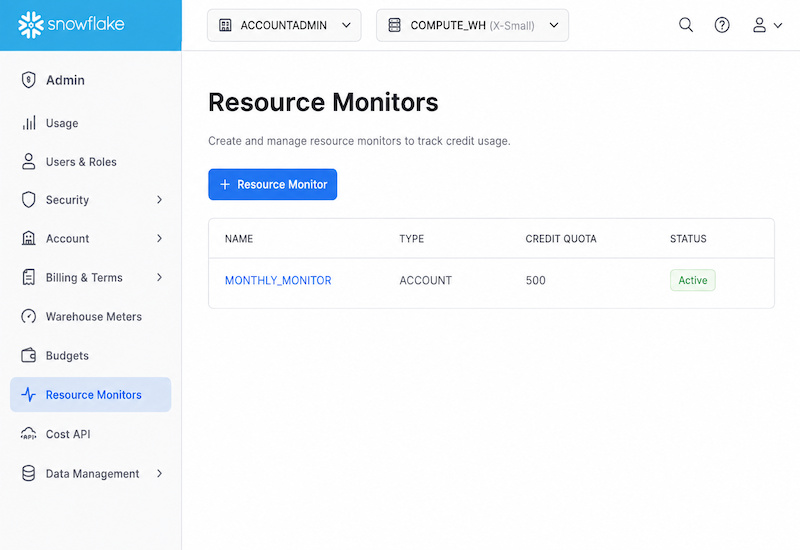
Step 3. Enter a monitor name and credit quota, then choose whether to monitor the account or selected warehouses.
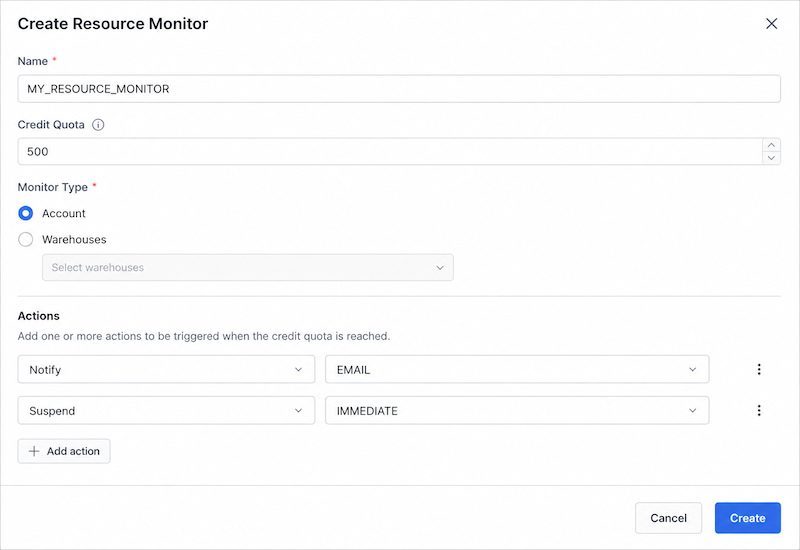
Step 4. Set actions and thresholds, such as sending a notification or suspending a warehouse when the quota is reached.
Conclusion
A resource monitor turns vague PC slowdowns into measurable CPU, memory, disk, and network activity. Windows Resource Monitor and Task Manager are useful for diagnosis, while Snowflake uses the same term for cloud-credit management. Windows users who also want cleanup and optimization controls can use Advanced SystemCare to combine performance monitoring with RAM cleaning, disk cleanup, large-file management, and system boosting.
Advanced SystemCare Free
- Clean: 420 billion traces removed & 85 EB junk files cleaned
- Protect: 80 million unauthorized access blocked & 20 million bugs fixed
- Speed Up: 6 million hours of startup time saved & Turbo boost
- Optimize: Auto clean and auto care your PC with AI mode